在之前没记录任何日志的时候,想要分析 IOS 应用崩溃只能靠重现步骤,然后在自己设备上重现后通过调试 crash 崩溃断点分析具体原因。但其实到后期很多明显的 crash 都已经被解决的差不多了,于是我就利用 NSSetUncaughtExceptionHandler 接口捕获异常并通过 Thread.callStackSymbols 来打印异常时的调用栈。
static var previoursHandler: NSUncaughtExceptionHandler?
func initSignalExceptionHandler() {
    // 注册 Uinx 异常退出信号处理函数
    let signals = [SIGABRT, SIGBUS, SIGFPE, SIGILL, SIGTRAP, SIGSEGV]
    for item in signals {
        signal(item) { signo in
            let callStacks = Thread.callStackSymbols
            print("ClientMainProcess srash signal:\(signo) \(callStacks.joined(separator: "\n"))")
        }
    }

    // 注册 NSSetUncaughtExceptionHandler 未捕获异常
    AppDelegate.previoursHandler = NSGetUncaughtExceptionHandler()
    NSSetUncaughtExceptionHandler { exception in
        if let handler = AppDelegate.previoursHandler {
            handler(exception)
        }
        let callStacks = Thread.callStackSymbols
        print("ClientMainProcess srash NSSetUncaughtExceptionHandler exception:\(exception) \(callStacks.joined(separator: "\n"))")
    }
}
并且将崩溃和栈信息通过日志模块(上述代码中 print 在具体项目中使用项目的日志工具记录)输出记录到日志文件中,通过用户上传日志收集到相关信息。不过很可惜的是,由于这里获取到的栈信息十分有限且基本为未符号化的,如果问题稍微复杂一点或者之前没有遇到过的话分析起来很麻烦又或者说,仅仅是一个死亡记录。
于是我就想着,得找一个比较靠谱的 crash 日志记录工具(当然现在这块市面上也有成熟的平台和 SDK 集成方案且我们公司其实有部署 Sentry 不过我们的日志收集是自己写的更何况我还是希望能够将日志文件先仅保存到用户设备中,在用户明确愿意上传时才收集用户日志才是最好的用户体验我觉得,其次就是我还是想折腾折腾),于是乎我找了一圈社区发现大家普遍比较推荐使用 KSCrash,但是我个人感觉这个库虽然蛮强大,但是用起来还是踩了不少坑的(后续有博客单独讲)。
至于如何从设备中获取 crash 文件,这个已经有无数博客和问答讲了,我就不再废话了。我博客主要针对目前获取到 apple format crash 文件(以苹果格式输出的 Crash 记录文件)后如何找到 crash 的点然后通过解析(符号化)定位到具体代码行。其实也有不少博客说 Xcode 能直接打开 crash 文件看到符号化后的文件,但是我目前测试 Xcode Version 15.4 (15F31d) 发现能导入并打开但是无法符号化也就是说并不能定位到代码(不过如果图简单的话,我还是建议你先尝试一下,毕竟这是最方便的,如果你也想入门了解一下整个流程和思路的话可以继续看下去)。
IOS crash 文件内容分析
首先我们获取到 crash 文件后打开文件内容需要关注几个相关的点,进程名称、发生 Crash 的线程、线程的调用栈,如下图所示。
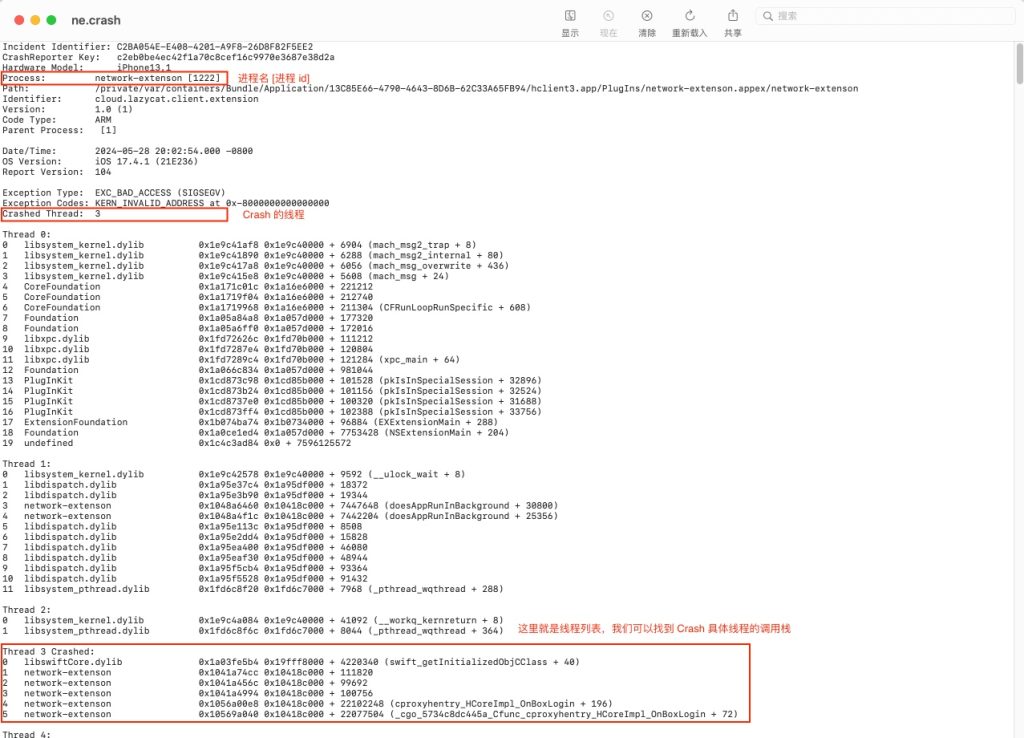
我们来看看调用栈信息的分析,其中有进程名称、调用函数地址、偏移量、符号化字符串等信息。

接着我们往下滑动能够找到 Binary Images 部分,通过上面知道的进程名称,我们找到对应进程的内存起始地址、终止地址、进程名称、架构、文件 UUID 等信息。
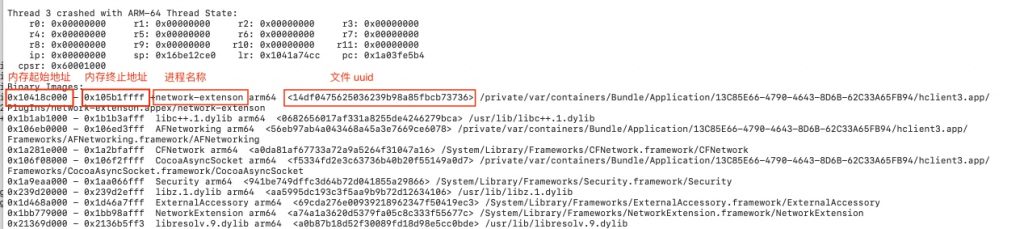
现在我们基本获取到 crash 文件信息了,当然其中还有很多信息可以扩展的去了解一下。后面我们将利用进程调用栈的内存信息。
如何获取 dSYM 文件?
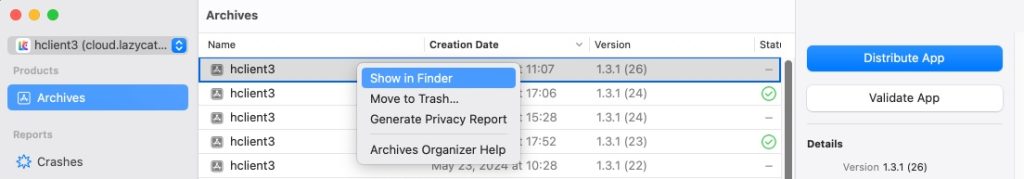
必须得在构建这个应用版本的机器上,在 Xcode 的菜单栏中选择 Window -> Organizer -> Archives
选择你 Crash 文件对应的版本,右键菜单选择 Show in Finder,在访达中打开
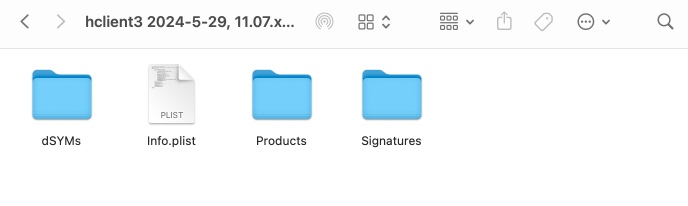
右击菜单中显示包内容,在其中的 dSYMs 应该会包含你此版本的进程二进制文件对应的 dSYM 文件。
符号化调用栈,找到具体代码行
在 macos 中有一个 分析 Crash log 的工具 atos
NAME
     atos – convert numeric addresses to symbols of binary images or processes

SYNOPSIS
     atos [-o <binary-image-file> | <dSYM>] [-p <pid> | <partial-executable-name>] [-arch architecture] [-l <load-address>] [-s <slide>] [-offset] [-printHeader] [-fullPath]
          [-i] [-d <delimiter>] [-f <address-input-file>] [<address> ...]

DESCRIPTION
     The atos command converts numeric addresses to their symbolic equivalents.  If full debug symbol information is available, for example in a .app.dSYM sitting beside a .app,
     then the output of atos will include file name and source line number information.

     The input addresses may be given in one of three ways:

     1.   A list of addresses at the end of the argument list.

     2.   Using the -f <address-input-file> argument to specify the path of an input file containing whitespace-separated numeric addresses.

     3.   If no addresses were directly specified, atos enters an interactive mode, reading addresses from stdin.

     The symbols are found in either a binary image file or in a currently executing process, as specified by:

     -o <binary-image-file> | <dSYM>
             The path to a binary image file or dSYM in which to look up symbols.

     -p <pid> | <partial-executable-name>
             The process ID or the partial name of a currently executing process in which to look up symbols.

     Multiple process IDs or paths can be specified if necessary, and the two can be mixed in any order.  When working with a Mach-O binary image file, atos considers only
     addresses and symbols defined in that binary image file, at their default locations (unless the -l or -s option is given).  When working with a running process, atos
     considers addresses and symbols defined in all binary images currently loaded by that process, at their loaded locations.

     The following additional options are available.

     -arch architecture
             The particular architecure of a binary image file in which to look up symbols.

     -l <load-address>
             The load address of the binary image.  This value is always assumed to be in hex, even without a "0x" prefix.  The input addresses are assumed to be in a binary
             image with that load address.  Load addresses for binary images can be found in the Binary Images: section at the bottom of crash, sample, leaks, and malloc_history
             reports.

     -s <slide>
             The slide value of the binary image -- this is the difference between the load address of a binary image, and the address at which the binary image was built.  This
             slide value is subtracted from the input addresses.  It is usually easier to directly specify the load address with the -l argument than to manually calculate a
             slide value.

     -offset
             Treat all given addresses as offsets into the binary. Only one of the following options can be used at a time: -s , -l or -offset.

     -printHeader
             If a process was specified, the first line of atos output should be a header of the form "Looking up symbols in process <pid> named:  <process-name>".  This is
             primarily used when atos is invoked as part of a stackshot(1) run, for verification of the process ID and name.

     -fullPath
             Print the full path of the source files.

     -i      Display inlined symbols.

     -d <delimiter>
             Delimiter when outputting inline frames. Defaults to newline.

EXAMPLE
     A stripped, optimized version of Sketch was built as an x86_64 position-independent executable (PIE) into /BuildProducts/Release.  Full debug symbol information is
     available in Sketch.app.dSYM, which sits alongside Sketch.app.  When Sketch.app was run, the Sketch binary (which was built at 0x100000000) was loaded at 0x10acde000.
     Running 'sample Sketch' showed 3 addresses that we want to get symbol information for -- 0x10acea1d3, 0x10ace4bea, and 0x10ace4b7a.

     First notice that the .dSYM is next to the .app:

     % ls -1 /BuildProducts/Release/
     Sketch.app
     Sketch.app.dSYM

     Now, to symbolicate, we run atos with the -o flag specifying the path to the actual Sketch executable (not the .app wrapper), the -arch x86_64 flag, and the -l 0x10acde000
     flag to specify the load address.

     % atos -o /BuildProducts/Release/Sketch.app/Contents/MacOS/Sketch -arch x86_64 -l 0x10acde000  0x10acea1d3 0x10ace4bea 0x10ace4b7a
     -[SKTGraphicView drawRect:] (in Sketch) (SKTGraphicView.m:445)
     -[SKTGraphic drawHandlesInView:] (in Sketch) (NSGeometry.h:110)
     -[SKTGraphic drawHandleInView:atPoint:] (in Sketch) (SKTGraphic.m:490)

     The same goal can be achieved by running atos with the dSYM:

     % atos -o /BuildProducts/Release/Sketch.app.dSYM -arch x86_64 -l 0x10acde000  0x10acea1d3 0x10ace4bea 0x10ace4b7a
     -[SKTGraphicView drawRect:] (in Sketch) (SKTGraphicView.m:445)
     -[SKTGraphic drawHandlesInView:] (in Sketch) (NSGeometry.h:110)
     -[SKTGraphic drawHandleInView:atPoint:] (in Sketch) (SKTGraphic.m:490)

GETTING SYMBOLS FOR A DIFFERENT MACHINE ARCHITECTURE
     It is possible to get symbols for addresses from a different machine architecture than the system on which atos is running.  For example, when running atos on an Intel-
     based system, one may wish to get the symbol for an address that came from a backtrace of a process running on an ARM device.  To do so, use the -arch flag to specify the
     desired architecture (such as i386 or arm) and pass in a corresponding symbol-rich Mach-O binary image file with a binary image of the corresponding architecture (such as a
     Universal Binary).
通过上面 crash 文件中得到的 进程起始地址、调用函数地址 就可以利用 atos 在 dSYM 文件中查找,这个调用在代码中具体的位置(符号化字符串)了,调用示例如下
$ atos -arch arm64 -o /Users/your/Download/network-extenson.appex.dSYM -l 0x10418c000 0x1041a456c

PortalHelper.onBoxLogin(_:boxdomain:extra_info:) (in network-extenson) (PortalHelper.swift:163)
自此,相信你已经能够基本分析应用 crash 的原因和掌握定位问题的方法了,值得提出的是除了 atos 工具之外,有几个相关的的工具也可以熟悉一下。
symbolicatecrash 是 Xcode 自带的一个工具,能够对整个 crash 文件进行符号化。通过以下方式能够找到这个工具的路径(因为不同 xcode 版本放的位置可能不同)
# 查看 symbolicatecrash 位置
$ find /Applications/Xcode.app/Contents/ -name symbolicatecrash -type f
/Applications/Xcode.app/Contents/SharedFrameworks/DVTFoundation.framework/Versions/A/Resources/symbolicatecrash

# 使用示例
$ /Applications/Xcode.app/Contents/SharedFrameworks/DVTFoundation.framework/Versions/A/Resources/symbolicatecrash app_crashs_2024_05_29.crash > result.log
dwarfdump 是一个转储和验证 DWARF 调试信息的工具。
$ dwarfdump --uuid <PathToDSYMFile>/Contents/Resources/DWARF/<BinaryName>
$ dwarfdump --uuid <PathToBinary>
参考链接
Apple Developer - Interpreting the JSON format of a crash report
Apple Developer - Adding identifiable symbol names to a crash report
Apple Developer - Building your app to include debugging information

作者您好,我们通过let callStacks = Thread.callStackSymbols 自己取堆栈信息未符号化的情况,这种有尝试处理过吗?我们做了一个crash防护框架,收集对应时机的stackTree. 但是release环境拿到的堆栈信息是未符号化过的。 我在想怎么处理。 伪装成Apple的.crash文件,看起来也不太靠谱。 或者就是写个脚本来解析拿到的每一行的函数地址那些了。 期待你的回复!
我大概了解你的需求,通过
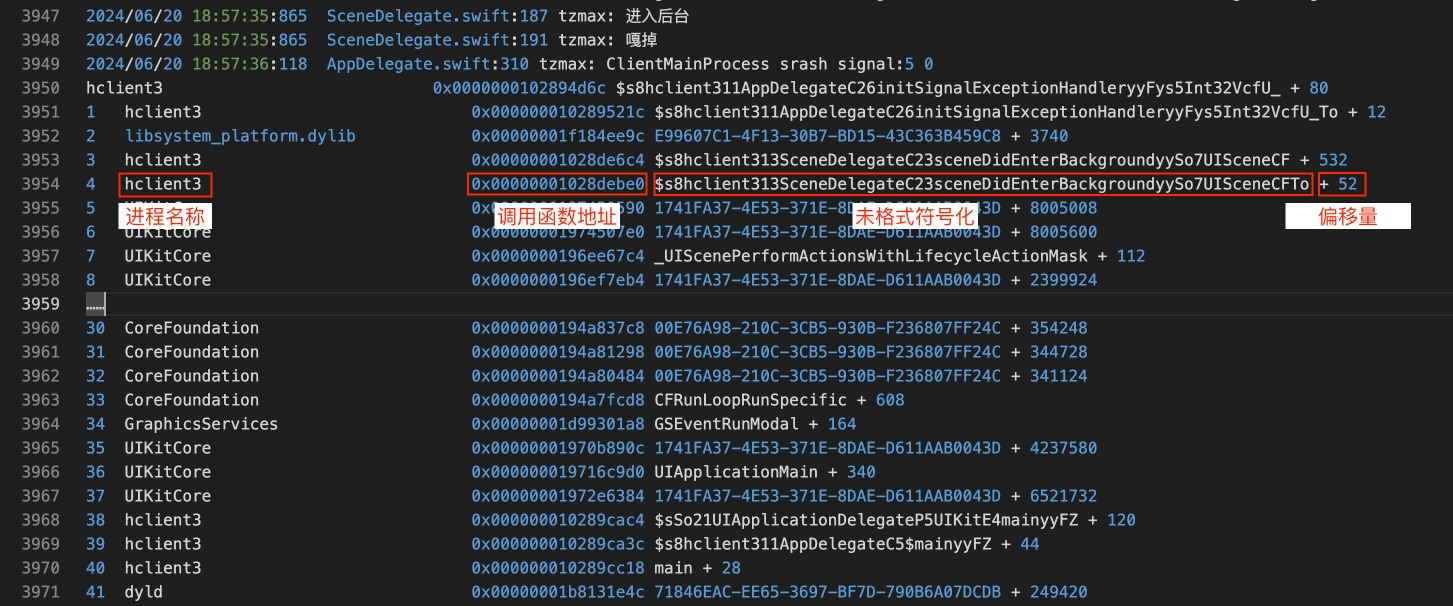
Thread.callStackSymbols打印的调用栈能够得到的信息大概如下图所示:得到的数据相比于 Apple crash 文件是缺少很多数据点的,这里仅是获取到 crash 时的调用栈,想通过这有限的数据转换为 crash 文件是不可行的(如果想要收集完整的 crash 数据可以参考 KSCrash,当然相比自己造轮子我更推荐直接使用它,如果它不满足自己需求的时候可以尝试扩展它,如果你要对接 KSCrash 的话可以参考我另一篇博客 Swift 集成 KSCrash IOS 崩溃跟踪并扩展输出 Crash 日志到指定文件 或许会对你有帮助)。
当然如果你想问的是我们该如何符号化
Thread.callStackSymbols打印出来的调用栈信息的话,这是另外一个话题,由于篇幅问题我没法一两句说清楚,如果你感兴趣的话我倒是可以找个时间另外写篇博客说说。我这里可以给你一些思路和参考资料。通过上面的图可以得知,其实 调用函数地址 都能够得到了,那么想使用 atos 工具符号化函数的话就只需要再找到 进程起始地址 就好了,我在查阅资料后发现其实是能够在运行时通过 mach-o 获取到全部的 images 信息的,这样的话只需要在崩溃的时候或者启动应用的时候将相关的 images 信息先记录下来就能够符号化崩溃调用栈信息了。
相关参考资料:
How to determine binary image architecture at runtime?
sentry-cocoa SentryCrashDynamicLinker.c
Opensource Apple Mach-o dyld.h